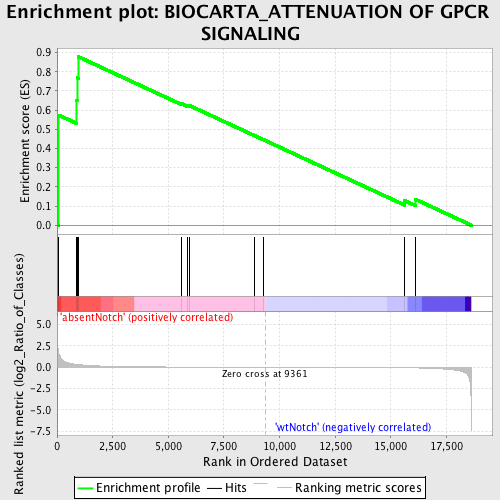
Profile of the Running ES Score & Positions of GeneSet Members on the Rank Ordered List
| Dataset | Set_03_absentNotch_versus_wtNotch.phenotype_absentNotch_versus_wtNotch.cls #absentNotch_versus_wtNotch.phenotype_absentNotch_versus_wtNotch.cls #absentNotch_versus_wtNotch_repos |
| Phenotype | phenotype_absentNotch_versus_wtNotch.cls#absentNotch_versus_wtNotch_repos |
| Upregulated in class | absentNotch |
| GeneSet | BIOCARTA_ATTENUATION OF GPCR SIGNALING |
| Enrichment Score (ES) | 0.8778247 |
| Normalized Enrichment Score (NES) | 1.474277 |
| Nominal p-value | 0.026369167 |
| FDR q-value | 1.0 |
| FWER p-Value | 1.0 |
| PROBE | DESCRIPTION (from dataset) | GENE SYMBOL | GENE_TITLE | RANK IN GENE LIST | RANK METRIC SCORE | RUNNING ES | CORE ENRICHMENT | |
|---|---|---|---|---|---|---|---|---|
| 1 | GNAS | 630441 1850373 4050152 | 73 | 1.512 | 0.5740 | Yes | ||
| 2 | PRKACB | 4210170 | 882 | 0.318 | 0.6520 | Yes | ||
| 3 | PRKAR1A | 3450369 | 910 | 0.310 | 0.7689 | Yes | ||
| 4 | GNB1 | 2120397 | 962 | 0.292 | 0.8778 | Yes | ||
| 5 | PRKAR1B | 6130411 | 5590 | 0.013 | 0.6343 | No | ||
| 6 | GNGT1 | 5220156 | 5860 | 0.012 | 0.6244 | No | ||
| 7 | PRKAR2A | 2340136 | 5954 | 0.011 | 0.6237 | No | ||
| 8 | GRK4 | 3840347 5340113 | 8870 | 0.001 | 0.4675 | No | ||
| 9 | PRKAR2B | 3130593 5220577 | 9292 | 0.000 | 0.4449 | No | ||
| 10 | ARRB1 | 2650670 2690195 4920592 6660121 | 15625 | -0.061 | 0.1280 | No | ||
| 11 | PRKCA | 6400551 | 16106 | -0.085 | 0.1349 | No |

